# R
:::danger
## Schedule
### Day 2 Tuesday 26th: morning session
[Setup](https://swcarpentry.github.io/r-novice-gapminder/setup.html) (Korbinian)
R for Reproducible Scientific Analysis
**[Introduction to R and RStudio](https://swcarpentry.github.io/r-novice-gapminder/01-rstudio-intro.html)** (David)
**[Project Management With RStudio](https://swcarpentry.github.io/r-novice-gapminder/02-project-intro.html)** (Korbinian)
**[Seeking Help](https://swcarpentry.github.io/r-novice-gapminder/03-seeking-help.html)** (David)
*10:30 Break*
10:45 R for Reproducible Scientific Analysis (Continued)
**[Data Structures](https://swcarpentry.github.io/r-novice-gapminder/04-data-structures-part1.html)** (Korbinian)
12:00 Lunch
:::
Please make sure you have R and RStudio installed for later. [Please see the setup information🙂](https://korbinib.github.io/2022-12-05-UiB-swc/#r)
If possible, please also install some R packages for later. On Mac/Linux in your bash type (after installing R):
```R -e 'install.packages("tidyverse",repos = "https://cran.uib.no/")'```
On Windows you can install them in RStudio, for example by creating a script _prepare_installation.r_:
```
install.packages("tidyverse")
library(tidyverse)
```
*****
## R installation
[Setup instructions](https://swcarpentry.github.io/r-novice-gapminder.html)
## [Introduction to R and RStudio](https://swcarpentry.github.io/r-novice-gapminder/01-rstudio-intro.html)
**[Cheatsheet R](https://github.com/rstudio/cheatsheets/raw/main/base-r.pdf)**
Different people use different conventions for long variable names, these include
* periods.between.words
* underscores_between_words
* camelCaseToSeparateWords
What you use is up to you, but be **consistent**.
[Tidyverse Style Guide](https://style.tidyverse.org/syntax.html)
[Google's R Style Guide](https://google.github.io/styleguide/Rguide.html)
:::warning
### Challenge 1
Which of the following are valid R variable names? add 😀 | 😞 behind each
min_height
max.height
_age
.mass
MaxLength
min-length
2widths
celsius2kelvin
:::
**Q & A:**
* what is the difference between = and <- assignments to variables?
* in function arguments you can only use `=`; other than that there are no major differences.
* I cannot clean the console on my MAC, tried press option command L as well..
* Try Control small l
* Worked! thanks
* you can also do it with the mouse 
* I am installing packages, and it is taking forever.. Can't do much now.
* to assign y to 2*x really, would one have to make a function? or maybe use symbolic?
* Using x <- 2*x will assign a static variable (previous value of x times 2), for a different behaviour functions will help you if you want to do this more often
* What is the difference coding in the consol vs coding in the file window?
* none, but you can save the file to rerun it (as a script) later :) - Your console is not persistent
* from where to open descriptive window?
* assuming this is about the file view: click the file -> new file -> R script
* don't you usually install packages in the script instead of console?
* no, as you only need to install them once. You will need to make them available with library(packagename) which is often done in the script. We will get to this.
* WARNING: Rtools is required to build R packages but is not currently installed. Please download and install the appropriate version of Rtools before proceeding: https://cran.rstudio.com/bin/windows/Rtools/ Warning in install.packages : 'lib = "packages"' is not writable
* I guess you should install Rtools before. Please follow the instructions here: https://cran.r-project.org/bin/windows/Rtools/
* For gapminder installation, it says - Rtools is required
* on Windows try installing https://cran.r-project.org/bin/windows/Rtools/
* How can you be sure that the package is downloaded successfully?
* You can try to load it, for example library(tidyverse)
* what should happen in the console then? sorry, I mean what happens if you load with library (tidyverse)? If it comes up as an option with purple
* Could you specify?
* Depends on the package. If you do not get an error message it's usually good. Some packages (as tidyverse) will show you extra information.
* Ok, that make sense:)
:::success
### Key Points
* Use RStudio to write and run R programs.
* R has the usual arithmetic operators and mathematical functions.
* Use <- to assign values to variables.
* Use ls() to list the variables in a program.
* Use rm() to delete objects in a program.
* Use install.packages() to install packages (libraries).
:::
We will work with the gapminder data set with is the basis for [this inspiring talk from Hans Rosling 20min](https://www.youtube.com/watch?v=hVimVzgtD6w).
[4min short version](https://www.youtube.com/watch?v=Z8t4k0Q8e8Y)
## [Project Management With RStudio](https://swcarpentry.github.io/r-novice-gapminder/02-project-intro/index.html)
:::warning
### Challenge 1+2: Creating a self-contained project
We’re going to create a new project in RStudio:
1. Click the “File” menu button, then “New Project”.
2. Click “New Directory”.
3. Click “New Project”.
4. Type in the name of the directory to store your project, e.g. “my_project”.
5. If available, select the checkbox for “Create a git repository.”
6. Click the “Create Project” button.
### ...and open it again
1. Exit RStudio.
2. Navigate to the directory where you created a project in Challenge 1.
3. Double click on the `.Rproj` file in that directory.
:::
Link for Gapminder data: https://swcarpentry.github.io/r-novice-gapminder/data/gapminder_data.csv
:::success
### Key Points
* Use RStudio to create and manage projects with consistent layout.
* Treat raw data as read-only.
* Treat generated output as disposable.
* Separate function definition and application.
:::
## [Seeking Help](https://swcarpentry.github.io/r-novice-gapminder/03-seeking-help/index.html)
### R SessionInfo
R version 4.1.2 (2021-11-01)
Platform: x86_64-apple-darwin17.0 (64-bit)
Running under: macOS Big Sur 11.5.2
R version 4.2.3 (2023-03-15 ucrt)
Platform: x86_64-w64-mingw32/x64 (64-bit)
R version 4.3.1 (2023-06-16 ucrt)
Platform: x86_64-w64-mingw32/x64 (64-bit)
R version 4.3.1 (2023-06-16 ucrt) -- "Beagle Scouts"
Platform: x86_64-w64-mingw32/x64 (64-bit)
:::success
### Key Points
* Use `help()` to get online help in R.
* Use `?function-name` to read the documentation
* Use `??function-name` if you are not sure about spelling
* Read vignettes to learn more about usage
* Use `sessionInfo()` to get information about your R and package versions
:::
ELIXIR-NO has a helpdesk that can help you with your scripting for Life Science qqqhttps://elixir.no/helpdesk
## [Data Structures](https://swcarpentry.github.io/r-novice-gapminder/04-data-structures-part1/index.html)
```
cats <- data.frame(coat = c("calico", "black", "tabby"),
weight = c(2.1, 5.0, 3.2),
likes_strings = c(1, 0, 1))
```
There are 5 main types in R: **double, integer, complex, logical, and character.**
:::warning
Order of datatypes in R: **logical -> integer -> numeric -> complex -> character**
:::
:::success
### Key points
* Use `read.csv` to read tabular data in R.
* The basic data types in R are double, integer, complex, logical, and character.
* Use factors to represent categories in R.
:::
:::danger
# Schedule
## Day 2 Tuesday 26th: afternoon session
**[Exploring Data Frames](https://swcarpentry.github.io/r-novice-gapminder/05-data-structures-part2.html)** (David)
**[Subsetting Data](https://swcarpentry.github.io/r-novice-gapminder/06-data-subsetting.html)** (Korbinian)
**[Control Flow](https://swcarpentry.github.io/r-novice-gapminder/07-control-flow.html)** (Korbinian)
**[Creating Publication-Quality Graphics with ggplot2](https://swcarpentry.github.io/r-novice-gapminder/08-plot-ggplot2.html)** (David)
**[Data frame Manipulation with dplyr](https://swcarpentry.github.io/r-novice-gapminder/13-dplyr.html)** (Korbinian)
**Tidy data, wide and long tables** (Korbinian)
**[Writing Good Software](https://swcarpentry.github.io/r-novice-gapminder/16-wrap-up.html)** (David)
*16:00 END*
:::
## [Exploring Data Frames](https://swcarpentry.github.io/r-novice-gapminder/05-data-structures-part2.html)
:::warning
### Challenge
* Create a vector with numbers 1-26, then multiply by 2
my_vector <- 1:26
my_multiplied_vector <- my_fantastic_vector * 2
* Let's imagine that 1 cat year is equivalent to 7 human years
1. Create a vector called human_age by multiplying cats$age by 7
2. Convert human_age to a factor
3. Convert human_age back to a numeric vector using the as.numeric(function). Now divide it by 7 to get the original ages back. Explain what happened.
:::
:::warning
You can create a new data frame right from within R with the following syntax:
R
df <- data.frame(id = c("a", "b", "c"),
x = 1:3,
y = c(TRUE, TRUE, FALSE))
Make a data frame that holds the following information for yourself:
first name
last name
lucky number
:::
Starting with the gapminder dataset!
```gapminder <- read.csv("data/gapmnder_data.csv")```
Use ```str(gapminder)```, ```summary(gapminder)``` to get an overview about the data and try different functions such as ```dim()```, ```colnames()```, ```typeof()``` to explore the dataset.
### Key Points
* Use `cbind()` to add a new column to a data frame.
* Use `rbind()` to add a new row to a data frame.
* Remove rows from a data frame.
* Use `na.omit()` to remove rows from a data frame with NA values.
* Use `levels()` and `as.character()` to explore and manipulate factors.
* Use `str()`, `summary()`, `nrow()`, `ncol()`, `dim()`, `colnames()`, `rownames()`, `head()`, and `typeof()` to understand the structure of a data frame.
* Read in a csv file using `read.csv()`.
* Understand what `length()` of a data frame represents.
## [Subsetting Data](https://swcarpentry.github.io/r-novice-gapminder/06-data-subsetting.html)
:::info
### Vector numbering in R starts at 1
In many programming languages (C and Python, for example), the first element of a vector has an index of 0. In R, the first element is 1.
:::
:::info
### Tip: Non-unique names
You should be aware that it is possible for multiple elements in a vector to have the same name. (For a data frame, columns can have the same name — although R tries to avoid this — but row names must be unique.) Consider these examples:
```
x <- 1:3
x
```
**Output**
```
[1] 1 2 3
```
```
names(x) <- c('a', 'a', 'a')
x
```
**Output**
```
a a a
1 2 3
```
```
x['a'] # only returns first value
```
**Output**
```
a
1
```
```
x[names(x) == 'a'] # returns all three values
```
**Output**
```
a a a
1 2 3
```
:::
:::warning
### Challenge 3
Selecting elements of a vector that match any of a list of components is a very common data analysis task. For example, the gapminder data set contains country and continent variables, but no information between these two scales. Suppose we want to pull out information from southeast Asia: how do we set up an operation to produce a logical vector that is TRUE for all of the countries in southeast Asia and FALSE otherwise?
Suppose you have these data:
```R
seAsia <- c("Myanmar","Thailand","Cambodia","Vietnam","Laos")
## read in the gapminder data that we downloaded in episode 2
gapminder <- read.csv("data/gapminder_data.csv", header=TRUE)
## extract the `country` column from a data frame (we'll see this later);
## convert from a factor to a character;
## and get just the non-repeated elements
countries <- unique(as.character(gapminder$country))
```
There’s a wrong way (using only ==), which will give you a warning; a clunky way (using the logical operators == and |); and an elegant way (using %in%). See whether you can come up with all three and explain how they (don’t) work.
:::
The best way to do this problem is ```countries %in% seAsia```, which is both correct and easy to type (and read).
*We will look further into subsetting tomorrow. If you have not enough yet, take a look at challenge 7 and 8.*
:::success
### Key Points
* Indexing in R starts at 1, not 0.
* Access individual values by location using `[]`.
* Access slices of data using `[low:high]`.
* Access arbitrary sets of data using `[c(...)]`.
* Use logical operations and logical vectors to access subsets of data.
:::
## [Control Flow](https://swcarpentry.github.io/r-novice-gapminder/07-control-flow.html)
We want to compare life expectancy between continents in the gapminder dataset. To do this, we need a few tools.
If...else conditions follow the pattern:
```
# if
if (condition is true) {
perform action
}
# if ... else
if (condition is true) {
perform action
}
else if (other condition is true){
perform alternative action (optional)
}
else { # that is, if the condition(s) is/are false
perform alternative action
}
```
Sometimes, it is useful to use ```any()``` and ```all() ```in the conditions.
For loops follow the pattern:
```
# for loop
for (iterator in set of values) {
do a thing
}
# example
for (i in 1:10) {
print(i)
}
```
**Functions**
From here, it is only a small step to wrapping your script in a function with defined inputs and outputs that you can reuse. Functions follow the pattern:
```
my_function <- function(parameters) {
# perform action (e.g for loop, if...else condition)
# return value
}
```
You can read more about writing functions in R in the [Functions explained](https://swcarpentry.github.io/r-novice-gapminder/10-functions.html) lesson. We recommend to solve Challenge 1 and Challenge 2 as homework. You can find a model solution in the [Functions explained](https://swcarpentry.github.io/r-novice-gapminder/10-functions.html) lesson.
:::success
### Key Points
* Use `if` and `else` to make choices.
* Use `for` to repeat operations.
* Use `function` to define a new and reusable functions in R.
* Use parameters to pass values into functions.
:::
:::warning
### Challenge 1 (recommended homework)
Write a function called ```kelvin_to_celsius()``` that takes a temperature in Kelvin and returns that temperature in Celsius.
Hint: To convert from Kelvin to Celsius you subtract 273.15
:::
:::warning
### Challenge 2 (recommended homework)
Define the function to convert directly from Fahrenheit to Celsius, by reusing the two functions above (or using your own functions if you prefer).
:::
## [Creating Publication-Quality Graphics with ggplot2](https://swcarpentry.github.io/r-novice-gapminder/08-plot-ggplot2/index.html)
**Introducting Tidyverse**
You might have noticed that deviated from the lesson material by asking you to install the ```tidyverse``` package instead of installing the packages ```ggplot2```, ```dplyr``` and ```tidyr```. These, and other packages, are part of the```tidyverse``` package. ```Tidyverse``` is "an opinionated collection of R packages designed for data science. All packages share an underlying design philosophy, grammar, and data structures." You can read more about ```tidyverse``` [here](https://www.tidyverse.org/).
Yesterday and this morning, we have been following the Base-R syntax. Knowing about the principles and quirks of R is very useful when you start working with your own data and doing more complex things. For the rest of today, we will take a look at the```tidyverse``` grammar.
**Getting started with ggplot**
Gg stands for "grammar of graphics".
NB! The example plots are not exactly publication grade. A few **tricks & useful links to make plots more appealing**:
[**Cheatsheet ggplot2**](https://raw.githubusercontent.com/rstudio/cheatsheets/main/data-visualization.pdf)
[R graph gallery & code snippets](https://www.r-graph-gallery.com/index.html)
[ggplot2 themes](https://ggplot2.tidyverse.org/reference/ggtheme.html)
[Color palettes](https://colorbrewer2.org/)
[Scientific journal and sci-fi themes](https://cran.r-project.org/web/packages/ggsci/vignettes/ggsci.html)
[Arranging plots with cowplot](https://cran.r-project.org/web/packages/cowplot/vignettes/introduction.html)
[ggplot2 book](https://ggplot2-book.org/)
(available at the UiB library: https://bibsys-almaprimo.hosted.exlibrisgroup.com/permalink/f/1cruloh/BIBSYS_ILS71500376670002201)
[Fundamentals of Data Visualization book](https://clauswilke.com/dataviz/)
(available at the UiB library: https://bibsys-almaprimo.hosted.exlibrisgroup.com/permalink/f/8hnp7t/BIBSYS_ILS71576188470002201)
[Examples of Different Figure Types with Code] (https://www.data-to-viz.com/)
:::warning
### Challenge 5
Generate boxplots to compare life expectancy between the different continents during the available years.
Advanced:
Rename y axis as Life Expectancy.
Remove x axis labels.
:::
:::success
### Key Points
* Use ```ggplot2``` to create plots.
* Save you plots with ````ggsave```
* Think about graphics in layers: aesthetics, geometry, statistics, scale transformation, and grouping.
* Make use of cheatsheets, documentation, vignettes, and other resources.
:::
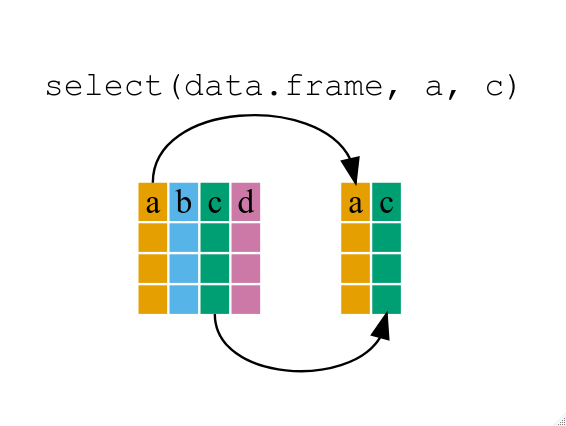
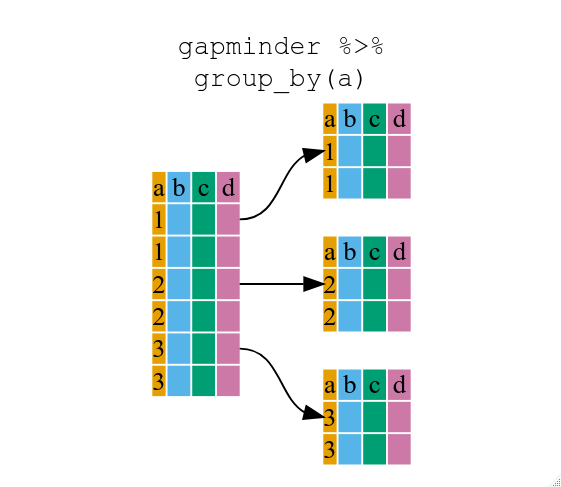
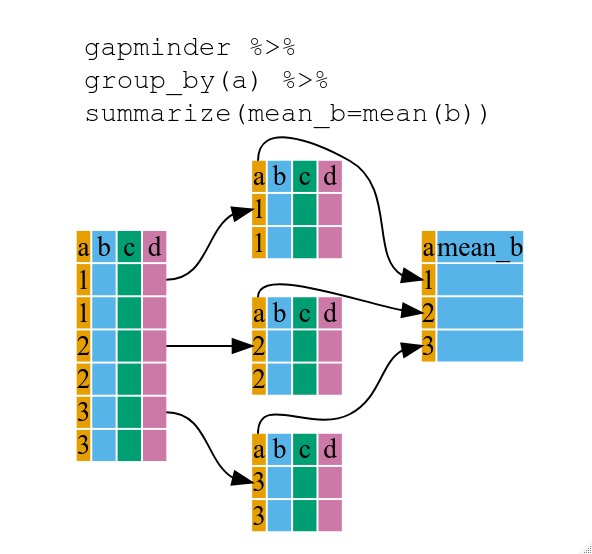
## [Data frame Manipulation with dplyr](https://swcarpentry.github.io/r-novice-gapminder/13-dplyr/index.html)
select()
filter()
group_by()
summarize()
mutate()
:::warning
%>% (pipe) shortcut: Ctrl +Shift +M
:::
[**dplyr cheatsheet**](https://posit.co/wp-content/uploads/2022/10/data-transformation-1.pdf)
:::success
### Key Points
* Use the dplyr package to manipulate data frames.
* Use select() to choose variables from a data frame.
* Use filter() to choose data based on values.
* Use group_by() and summarize() to work with subsets of data.
* Use mutate() to create new variables.
:::
**Further resources**
* [R for Data Science](http://r4ds.had.co.nz/)
* [Data Wrangling Cheat sheet](https://www.rstudio.com/wp-content/uploads/2015/02/data-wrangling-cheatsheet.pdf)
* [Introduction to dplyr](https://dplyr.tidyverse.org/)
* [Data wrangling with R and RStudio](https://www.rstudio.com/resources/webinars/data-wrangling-with-r-and-rstudio/)
## Tidy data, wide and long tables
Do you remember the manifesto that we looked at when checking ```vignette(package="tidyverse")```? One central concept in ```tidyverse``` is the reusability of data structures.
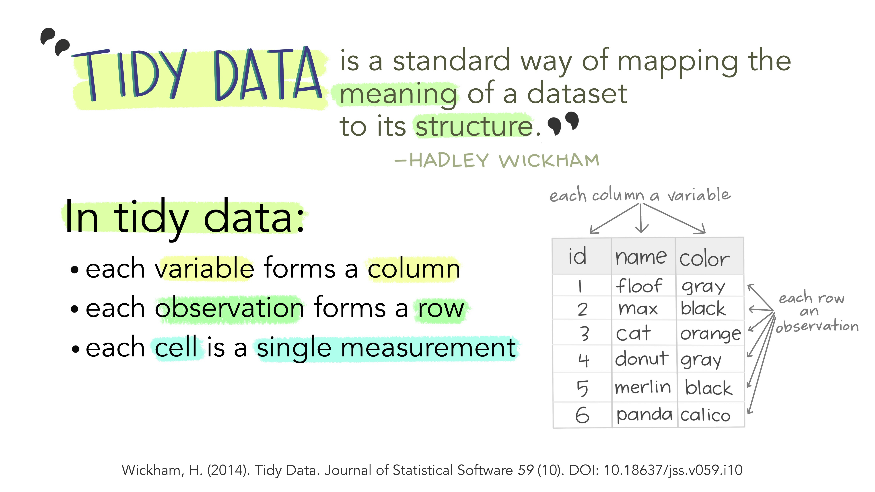
(illustration by [Allison Horst](https://github.com/allisonhorst/stats-illustrations))
Ggplot2 plots work best with data in the *long* format, i.e., a column for every variable, and a row for every observation. But what if you have several variables? The solution is to "wrangle" the data into a longtable.
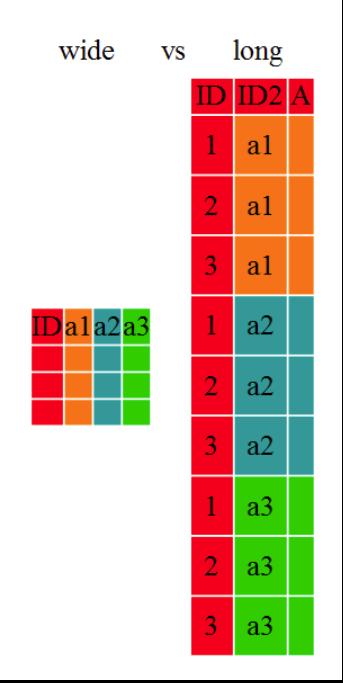
The tidyr package allows to conviently reformat data from *wide* to *long* format and back. Transformation of *wide* tables to *long* tables using the ```tidyr::pivot_longer()``` function and back using the ```tidyr::pivot_wider()``` function is explained in the [Data Frame Manipulation with tidyr](https://swcarpentry.github.io/r-novice-gapminder/14-tidyr/index.html) lesson (these functions were called ```tidyr::gather()``` & ```tidyr::spread()```earlier, which you may still find in older cheatsheets).
[**Cheatsheet data wrangling with dplyr & tidyr**](https://www.rstudio.com/wp-content/uploads/2015/02/data-wrangling-cheatsheet.pdf)
[**Cheatsheet tidyverse for beginners**](https://images.datacamp.com/image/upload/v1676302697/Marketing/Blog/Tidyverse_Cheat_Sheet.pdf)
## [Writing Good Software](https://swcarpentry.github.io/r-novice-gapminder/16-wrap-up/index.html)
:::success
### Key Points
* Keep your project folder structured, organized and tidy.
* Document what and why, not how.
* Break programs into short single-purpose functions.
* Write re-runnable tests.
* Don’t repeat yourself.
* Be consistent in naming, indentation, and other aspects of style. (have a look at the style resources shared yesterday!)
:::
:::info
## Skipped lessons R
**[9. Vectorization](https://swcarpentry.github.io/r-novice-gapminder/09-vectorization.html)**
We mentioned that vectorization is a powerful behaviour if calculating with R. This lesson goes more into depth.
**[10. Functions Explained](https://swcarpentry.github.io/r-novice-gapminder/10-functions.html)**
We have briefly talked about functions in the lesson about if...else statements and for loops.
**[11. Writing Data (in more depths)](https://swcarpentry.github.io/r-novice-gapminder/11-writing-data.html)**
We have read in and written data in different lessons, this one is a summary.
**[12. Splitting and Combining Data Frames with plyr](https://swcarpentry.github.io/r-novice-gapminder/12-plyr.html)**
More tidyverse grammar.
**[14. Data Frame Manipulation with tidyr](https://swcarpentry.github.io/r-novice-gapminder/14-tidyr.html)**
More tidyverse grammar. We have briefly talked about tidyr features in the context of tidy data and wide and long tables.
**[15. Producing Reports With knitr](https://swcarpentry.github.io/r-novice-gapminder/15-knitr-markdown.html)**
Writing reports with embedded R code and plots.
A popular alternative for embedded code and plots are [Jupyter Notebooks](https://jupyter.org/).
:::
**Further resources:**
Bioscientific packages: https://www.bioconductor.org/
https://cran.r-project.org/web/packages/available_packages_by_name.html
Next level: https://coderefinery.org/
[Coderefinery YouTube Channel](https://www.youtube.com/@coderefinery3414)
For further Training notification subscribe to [hpcnews@uib](https://mailman.uib.no/listinfo/hpcnews)
**Community in Bergen:**
* [RLadies Bergen](https://www.meetup.com/rladies-bergen/?_cookie-check=EEFbvku63iQtPzVC)
* [BioCeed R coding club](https://coderclub.w.uib.no/)